| nr. | Table name in 1987 document |
| TABLE A | |
| 2 | TABLE 1 - ROEMER METHOD VALUES |
| 3 | TABLE B |
| 4 | TABLE 3 - BRADLEY ABERRATION METHOD: PULKOVA VALUES MARKED * |
| 5 | TABLE 4 - TOOTH WHEEL EXPERIMENTAL VALUES |
| 6 | TABLE 5 - ROTATING MIRROR EXPERIMENTS |
| 7 | TABLE 6 - KERR CELL VALUES* OF C |
| 8 | TABLE 7 - RESULTS* BY SIX METHODS 1945-1960 |
| 9 | TABLE 9 - C VALUES BY THE RATIO OF ESU/EMU |
| 10 | TABLE 10 - C VALUES BY WAVES ON WIRES |
| 11 | TABLE 11 - REFINED LIST OF C DATA (See Figs. II, III, IV) |
| 12 | TABLE 21 - COMPARISON OF CURVES FITTED TO ALL TABLE 11 DATA |
| 13 | TABLE 22 - RESULTS OF ANALYSIS OF SPEED OF LIGHT DATA |
Problem description.
Let there be given a set of $N$ real-valued data points $(T_k,c_k)$. In addition, $c_0$ and $T_0$ are known fixed values.
Find the (Least Squares) best fit of these points to the hyperbola
$$
c = c_0\frac{T_0-A}{T-A}
$$
The general form of the Least Squares data fit problem is:
$$
\sum_k \left[\;F(T_k,c_k,A)\;\right]^2 = \mbox{minimum}(A)
$$
Our purpose is to find $A$. The function $F(T,c,A)$ is not unique, thereby giving rise to several methods.
What's worse: with (very) different outcomes for $A$. It should be noted that the actual problem is rather
ill-conditioned, but I want to have results nevertheless.
Method 1.
$$
F(T,c,A) = c(T-A)-c_0(T_0-A) \quad \Longrightarrow \\
\sum_k \left[c_k(T_k-A)-c_0(T_0-A)\right]^2 = \mbox{minimum}(A)
$$
The minimum is found by differentiation and $dF/dA = 0$, giving:
$$
A = \frac{\sum_k (T_kc_k-T_0c_0)(c_k-c_0)}{\sum_k(c_k-c_0)^2}
$$
Method 2.
$$
F(T,c,A) = A - \frac{Tc-T_0c_0}{c-c_0} \quad \Longrightarrow \\
\sum_k \left[A - \frac{T_kc_k-T_0c_0}{c_k-c_0}\right]^2 = \mbox{minimum}(A)
$$
The minimum is found again by putting $dF/dA = 0$, giving:
$$
A = \frac{1}{N} \sum_k \frac{T_kc_k-T_0c_0}{c_k-c_0}
$$
Method 3. Without least squares:
$$
\overline{T} = \frac{1}{N}\sum_k T_k \quad ; \quad \overline{c} = \frac{1}{N}\sum_k c_k \quad \Longrightarrow \\
A = \frac{\overline{T}.\overline{c}-T_0c_0}{\overline{c}-c_0}
$$
There is no secret with the source code of the (Delphi Pascal) programs employed for the data fit:
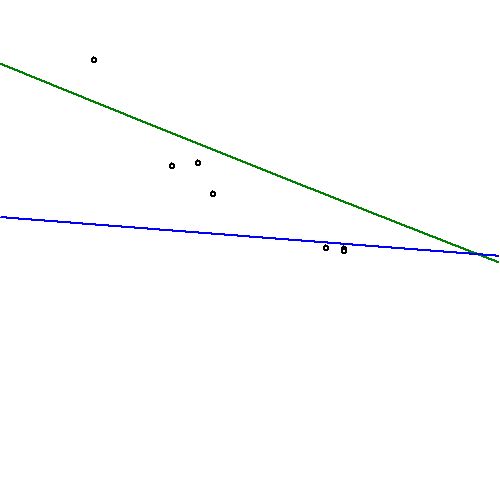
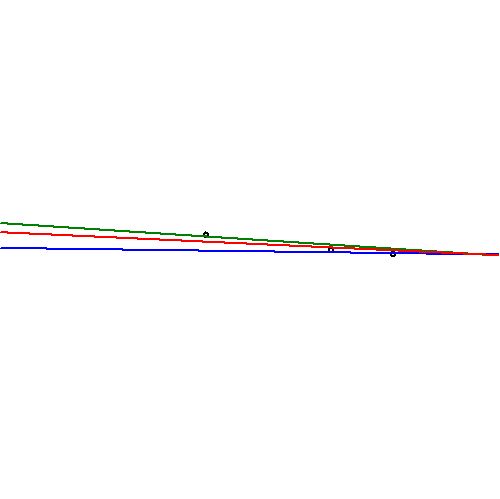
| table | method 1 | method 2 | method 3 | graph |
| 1.txt | -325,413 | -1,423,711 | -496,282 | 1.jpg |
| 2.txt | -13,394 | -75,379 | 5,089 | 2.jpg |
| 3.txt | -90,126 | -453,301 | -128,157 | 3.jpg |
| 4.txt | -21,805 | -38,506 | -356,226 | 4.jpg |
| 5.txt | -1,101 | -120,034 | -10,792 | 5.jpg |
| 6.txt | 15,574 | -790,987 | 204,518 | 6.jpg |
| 7.txt | 745,298 | 1,160,883 | 871,730 | 7.jpg |
| 8.txt | -1,448,385 | 10,066,734 | -2,762,4247 | 8.jpg |
| 9.txt | 3,552 | -75,689 | 4,561 | 9.jpg |
| 10.txt | 2,641 | -1,133,758 | 327,940 | 10.jpg |
| 11.txt | -104,606 | 5,095,436 | -297,469 | 11.jpg |
| 12.txt | -94,900 | 1,713,813 | -158,783 | 12.jpg |
| 13.txt | -86,008 | 490,001 | 5,559 | 13.jpg |
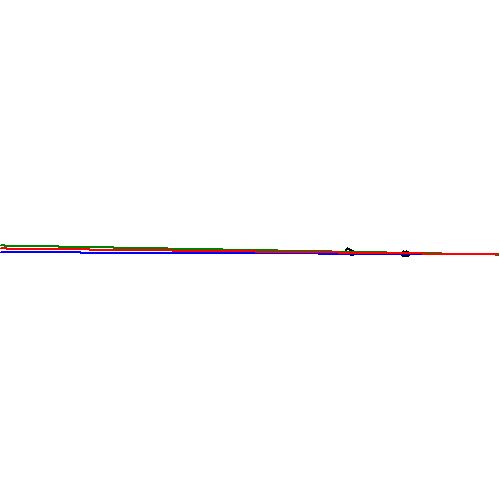
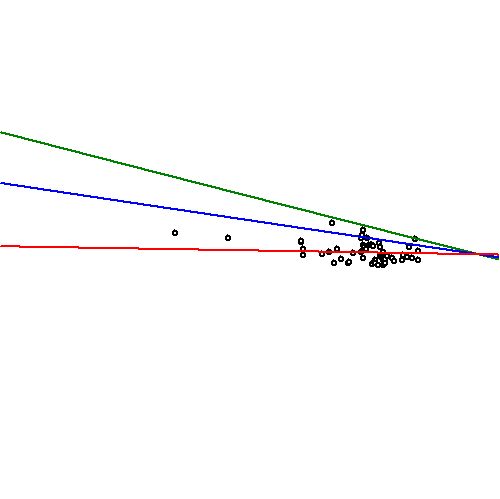
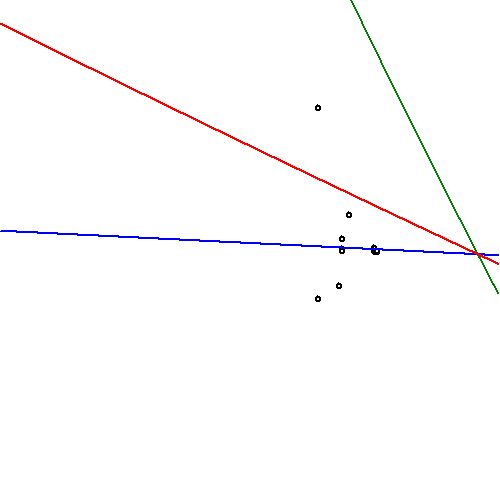
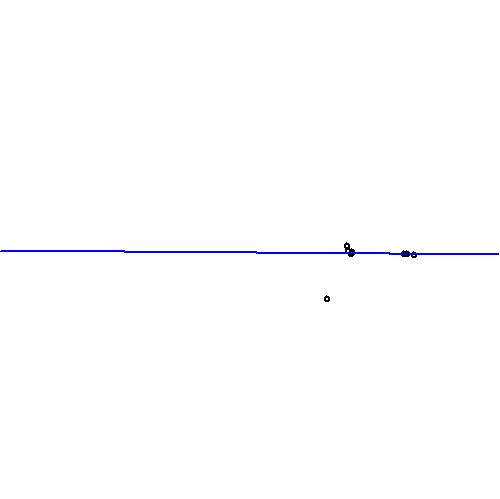
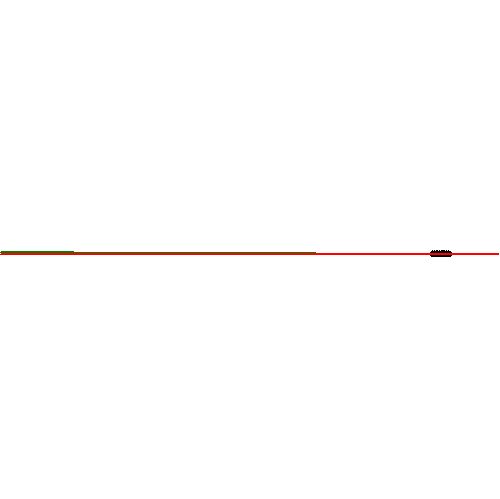
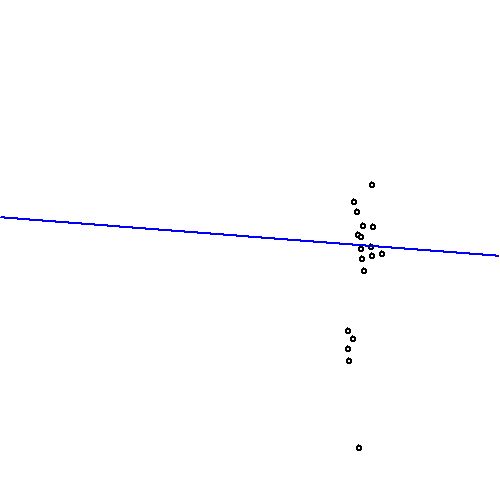
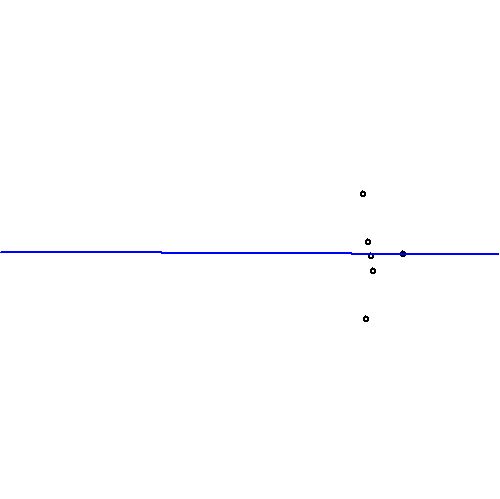
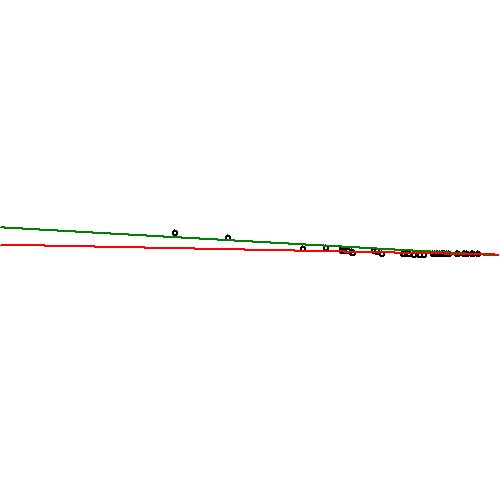
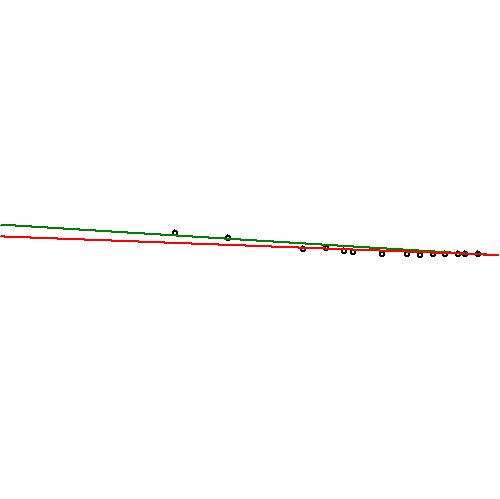
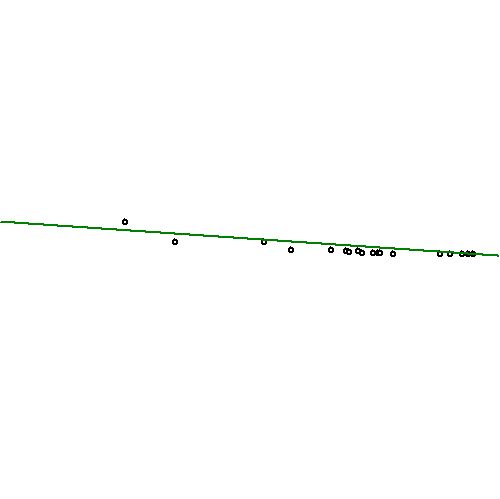
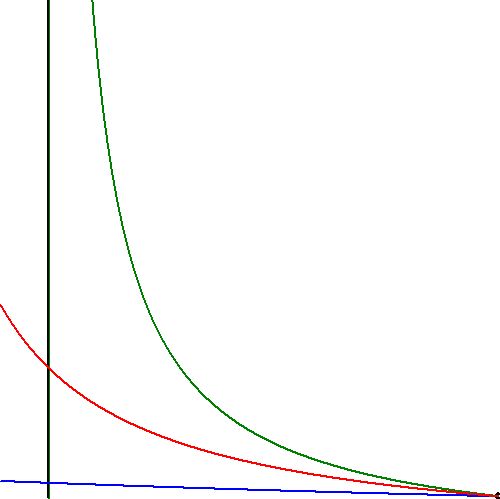
It is seen that there is an enormous spread in the results, which also becomes clear from the graph below.
The problem is extremely ill-conditioned, that's for sure; just look at the data
that must do the job, almost invisible, rightmost in the picture.
The above results have been generated with $c = c_0.(T_0-A)/(T-A)$ as the basic template. At an earlier stage, we have solved a slightly more general problem, which has been published as a question at the Mathematics Stack Exchange platform, without significantly better results though: Error $\Delta A$ in Least Squares best fit of data to hyperbola $y=B/(x-A)$.