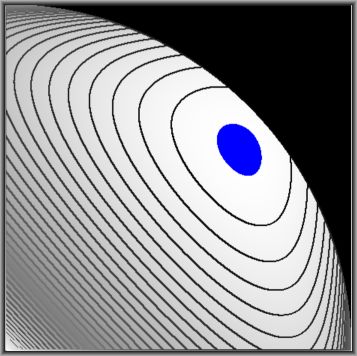
Another proof without words is attempted by plotting a contour map of the function, as depicted. Levels (`nivo`) of these isolines are defined (in Delphi Pascal) as:
nivo := min + g/grens*(max-min); { grens = 40 ; g = 1..grens }
The blackness of the isolines is proportional to the (positive) function values; they are almost white
near the minimum and almost black near the maximum values.
Maximum and minimum values of the function are observed to be:
2.54387743763872E+0000 < f < 3.91477606446737E+0000The $\color{blue}{\mbox{blue}}$ spot is where $\,\left| f(x,y) - 4 \right| < 0.9$ . It is suggested by the rather large error $\,0.9\,$ that $\,4\,$ is not really the maximum. Indeed, upon refinement of the grid we find for the maximum numerically (double precision) a somewhat lower value:
3.91477205860402 < 4