Express parametric curve as graph of a function

Disclaimer: this is a partial answer, because I couldn't find (yet) the explicit form of $g(x)$ .
First we must establish a few limits: $$ \lim_{t\to 0} f(t) = \lim_{t\to 0} \left[ \frac{1}{t}-\frac{1}{\mathrm{e}^t-1} \right] = \frac{1}{2} \quad ; \quad \lim_{t\to 0} \sqrt{-f'(t)} = \lim_{t\to 0} \sqrt{\dfrac1{t^2}-\dfrac{\mathrm e^t}{(\mathrm e^t-1)^2}} = \frac{1}{2\sqrt{3}} \\ \lim_{t\to \infty} f(t) = \lim_{t\to \infty} \sqrt{-f'(t)} = 0 $$ $$a(t) = f(t) \quad;\quad b(t) = \sqrt{-f'(t)} \quad \Longrightarrow \quad x(t) = a(t) + b(t) \quad;\quad y(t) = a(t) - b(t)$$ Then we have enough information for being able to develop a little (Pascal) computer program:
procedure Schetsen;
const
  deel : integer = 10;
  veel : integer = 10000;
var
  k,i,j : integer;
  t,x,y,a,b : double;
begin
  xmin := 0; xmax := 1;
  ymin := 0; ymax := 0.25;
  TV(Form1.Image1);
  ClearDevice;
  Form1.Image1.Canvas.Pen.Width := 3;
  for k := 0 to veel do
  begin
    t := k/deel;
    a := 1/2; b := sqrt(1/12);
    if t > 0 then
    a := 1/t-1/(exp(t)-1);
    if t > 0 then
    b := sqrt(1/sqr(t)-exp(t)/sqr(exp(t)-1));
    x := a + b; y := a - b;
    i := x2i(x); j := y2j(y);
    if k = 0
    then Form1.Image1.Canvas.MoveTo(i,j)
    else Form1.Image1.Canvas.LineTo(i,j);
  end;
end;
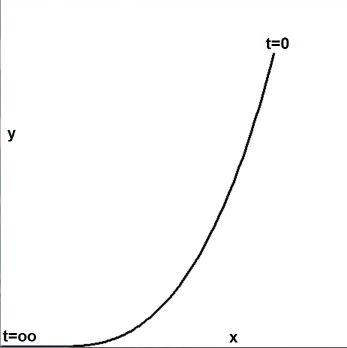
The above program snippet is the core of some modest graphics machinery, resulting in:

So yes, it seems that we have a function $\;g(x)\;$ as supposed by the OP.
But how about its explicit form?