What can be done with a computer is convolute the function (numerically) with a Gaussian
and set up a threshold for the difference between the original and the smoothed.
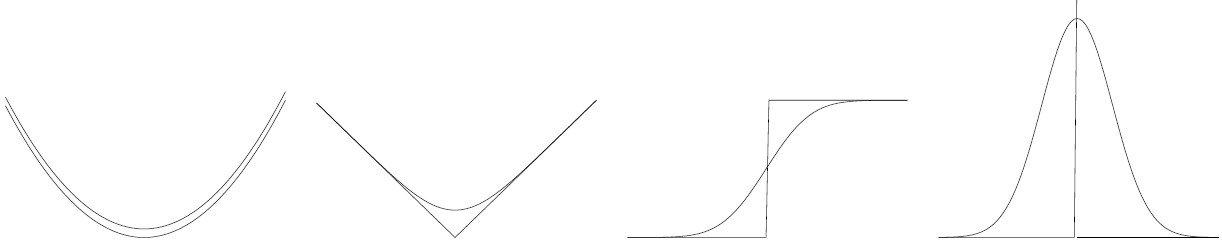
The picture below shows that it is possible in this way to detect places where the function is "less differentiable".
It's no way better than approximately, but what else can be expected if differentiability is to be observed from a graph.
The smoothed function is, theoretically (with "Gaussian blur"):
$$
\overline{f}(x) = \frac{1}{\sigma\sqrt{2\pi}} \int_{-\infty}^{+\infty} e^{-\frac{1}{2}(x-t)^2/\sigma^2} f(t)\, dt
$$
The integral will become a finite sum upon discretization (Instead of the Gaussian, any other decent "hat function"
can be used) From the left to the right: $y=x^2$, $y = |x|$, Heaviside, delta function.
Or did you simply mean: by human inspection? Then forget everything I've said :-(